In the fast-paced world of social media, data isn’t just a collection of numbers-it is the heartbeat of your digital presence. For creators, marketers, and businesses, understanding how an audience moves, reacts, and shares is the difference between viral success and digital silence. Recently, Instagram rolled out one of its most ambitious updates to the Insights UI, fundamentally changing how we perceive performance.
Why Meta is Redefining the Analytical Experience
For years, users complained that Instagram’s data was fragmented. You had “Plays” for Reels, “Impressions” for posts, and “Views” for Stories. It was a chaotic ecosystem that made cross-format comparison nearly impossible. Meta’s 2026 update addresses this by creating a “Common Language” for data. By standardizing metrics and simplifying the UI, Instagram is encouraging creators to think about their brand as a cohesive whole rather than a series of disconnected posts. The goal is clarity: less time spent squinting at spreadsheets and more time spent crafting stories that resonate.
Deconstructing the New UI: A Fresh Look for Modern Creators
The first thing you’ll notice when tapping into your Professional Dashboard is the visual weight of the data. Gone are the tiny text links and buried sub-menus. The new UI is built around “Summary Pills”-large, high-contrast visual blocks that give you an instant snapshot of your most vital KPIs. This “at-a-glance” philosophy ensures that even on a small mobile screen, you can immediately identify if your reach is trending up or if your engagement has taken a dip.
The Three-Tab Ecosystem: Overview, Engagement, and Audience
Instagram has finally moved away from the long-scrolling list of metrics in favor of a three-tabbed structure. This organization reflects the natural journey of content:
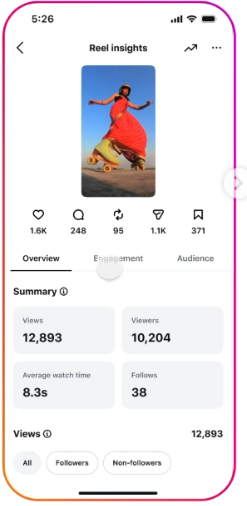
- Overview: This is your high-level mission control. It focuses on awareness and discovery, showing you the “Big Three”: Reach, Views, and Profile Activity.
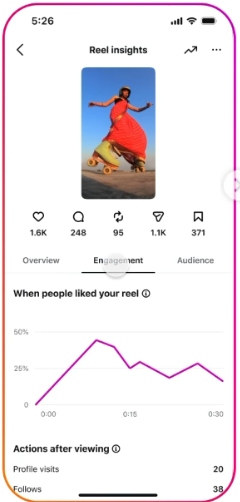
- Engagement: Here, the UI shifts its focus to the “quality” of your connections. It highlights saves, shares, and comments, but with a new emphasis on “Sends per Reach.”
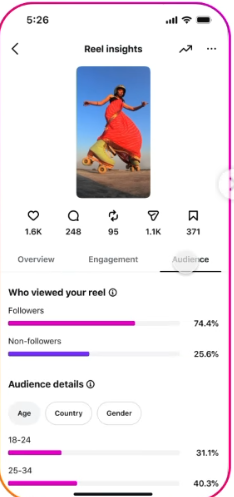
- Audience: This tab has been revamped to provide deeper psychological insights. It doesn’t just tell you where your followers live; it tells you when they are most likely to interact and which content formats they prefer.
The Rise of the “Universal View”: One Metric to Rule Them All
One of the most significant shifts in this update is the standardization of “Views” as the primary metric across all formats. Whether it’s a static photo, a 90-second Reel, a 15-second Story, or a three-hour Live stream, everything is now measured by Views. This change is more than semantic; it shifts the focus to “Exposure.”
Understanding the Shift from Reach to Views
In the old system, “Reach” was king. While Reach (the number of unique accounts) still exists, the UI now prioritizes “Views” (the total number of times content appeared on a screen). This acknowledges a fundamental truth of 2026: content is often consumed multiple times by the same person. A user might see a Reel in their feed, then see it again when a friend sends it to them via DM. By counting both as “Views,” Instagram provides a more accurate picture of the total “screen time” your brand is occupying. For SEO purposes and algorithm ranking, “Total View Time” and “Average Watch Time” have become the new gold standards for content health.
The “Sends” Revolution: Why DM Shares are the New Likes
If 2024 was the year of the “Like” and 2025 was the year of the “Save,” then 2026 is officially the year of the “Send.” Within the new Insights UI, “Sends per Reach” is given its own dedicated section. Instagram’s head, Adam Mosseri, has been vocal about the fact that the algorithm now prioritizes content that fosters private conversation. When a user sends your post to a friend, they are providing a “high-intent” signal that the content is valuable, relatable, or actionable.
Decoding the “Sends per Reach” Metric
The new UI doesn’t just show you a raw number of shares; it calculates the “Send Rate.” This is a percentage that compares how many people saw the post versus how many people felt compelled to pass it on. A high Send Rate tells the algorithm that your content is “virally potent.” In response, the system is more likely to push that content into the “Inspiration” tab or the “Explore” page. For brands, this means shifting strategy from “broadcasting” to “conversation-starting.” If your insights show a low send rate, it’s a signal that your content might be too self-serving and not “social” enough.
Deep Dive: Advanced Story and Reel Metrics
Stories and Reels continue to be the engines of growth on Instagram, and the new UI provides unprecedented granularity in how we track their performance. The “Retention Graph” is perhaps the most powerful tool added to the Reel insights section. It allows you to see exactly at what second viewers are dropping off.
Mastering Completion Rates and Exit Points
For Stories, the UI now explicitly tracks “Completion Rate” and “Forward Taps.” If you see a spike in “Exits” on the third slide of a Story sequence, the UI will highlight this as a “Content Friction Point.”
- Completion Rate: The percentage of users who watched your Story from the first slide to the last. This is your “loyalty” score.
- Forward Taps: While often seen as engagement, the new UI interprets high forward taps as a sign that your pacing is too slow. It’s a nudge to keep your Story content snappier and more visual.
- Rewatch Insights: A new metric for 2026, this shows how many users actually “tapped back” to see a slide again. This is a massive “quality” signal, indicating that the information on that slide was either highly engaging or required a second look.
Bridging the Gap: Archiving and Analyzing Viral Trends
As you dive deeper into the metrics, you will inevitably find content that shatters your previous records. In the editorial world, simply looking at the data isn’t enough; you need to archive these “gold standard” examples for future reference. Many professional creators now use a high-quality Instagram Reels Downloader to save their top-performing videos—and those of their competitors-directly to their local storage. This allows for a frame-by-frame breakdown of the “hooks” and “transitions” that the Insights UI is flagging as successful. By maintaining an offline library of viral Reels in MP4 format, you can ensure that your creative team has access to inspiration even when the algorithm shifts or content is moved. It’s about turning fleeting digital success into a permanent blueprint for your brand’s growth.
The Professional Dashboard: Your Central Hub for Growth Tools
The 2026 update hasn’t just improved the data; it has integrated the tools you need to act on that data directly into the Insights flow. The Professional Dashboard now acts as a “Smart Assistant,” suggesting specific actions based on your weekly performance.
Tool 1: The Inspiration Tab (Native Integration)
The Inspiration Tab has been upgraded with AI-driven “Trend Mapping.” Instead of just showing you what’s popular globally, it uses your specific account’s Insights to show you what is trending within your niche.
- How it works: If your “Audience” tab shows a high concentration of fitness enthusiasts, the Inspiration Tab will suggest audio tracks and Reel templates that are currently exploding in the fitness community.
- Why it’s different: It eliminates the guesswork of “What should I post today?” by bridging the gap between your data and the broader cultural trends.
Tool 2: The Creator Marketplace (Collaboration Metrics)
Monetization and collaboration are now baked directly into the UI. The “Marketplace” tool allows brands to find creators not just by follower count, but by “Average Send Rate” and “Audience Retention.”
- Detailed Description: This tool provides a “Media Kit” style view of your insights that you can share with potential partners. It includes “Verified Engagement” stats that are pulled directly from Instagram’s backend, ensuring transparency and trust between creators and brands.
Tool 3: Achievements and Gamification
To encourage consistent posting, Instagram has expanded its “Achievements” tool. This gamified experience tracks “Streaks,” “Collaboration Milestones,” and “Reach Breakthroughs.”
- Explanation: When you hit a new milestone (like 100,000 views on a single Reel), the UI unlocks “Pro Tips”-exclusive advice from Instagram’s internal growth team on how to maintain that momentum. It turns the often-draining task of content creation into a rewarding, goal-oriented experience.
Tool 4: Meta Business Suite (Crossposting Analytics)
While technically a separate app, the integration with the new Insights UI is seamless. The 2026 update allows you to see “Aggregated Views” across both Instagram and Facebook.
- Strategic Use: If a Reel is performing poorly on Instagram but exploding on Facebook, the UI will suggest a “Crosspost Optimization” strategy, helping you understand where your true audience resides. It also includes the “facebook_views” metric directly in your Instagram dashboard for a unified view of your Meta ecosystem.
Essential Third-Party Tools to Complement Native Insights
While Instagram’s native UI is more powerful than ever, professional editors and agencies often need more robust, multi-platform reporting. These tools have updated their APIs to integrate with the 2026 metrics seamlessly.
Sprout Social: The Enterprise Powerhouse
Sprout Social remains the gold standard for large brands. In 2026, it has introduced “AI Listening” that correlates your Instagram Insights with “Market Sentiment.”
- Why use it: It doesn’t just tell you that your post got 5,000 shares; it tells you the mood of the conversations happening around those shares. For a professional editor, this is the “juice” needed to pivot a brand’s voice in real-time.
Later: The Visual Content Architect
Later has transitioned from a simple scheduler to a “Predictive Analytics” platform. Its 2026 update includes a “Visual Grid Optimizer” that uses your Insights data to predict which thumbnail layouts will lead to the highest profile visit rate.
- Description: It essentially runs an A/B test on your profile’s aesthetic before you even hit publish, ensuring that your “Grid Flow” is optimized for follower conversion.
Iconosquare: The Deep-Data Diver
For those who love the “Audience” tab, Iconosquare offers even deeper segmentation. It allows you to track “Follower Churn” (who followed you and then quickly unfollowed) and “Competitor Benchmarking.”
- Explanation: It compares your “Send Rate” and “Completion Rate” against the average for your industry, giving you a clear picture of where you stand in the competitive landscape.
Minter.io: The Video Specialist
As video becomes the dominant format, Minter.io has carved out a niche by providing “Minute-by-Minute Engagement” reports.
- Description: It expands on Instagram’s native retention graph by showing exactly which “Tags” or “Mentions” caused a viewer to click away. It is the ultimate tool for refining high-production Reel content.
Turning Insights into Action: The 2026 Strategy Guide
Data is useless if it doesn’t lead to a change in behavior. As a professional editor, I recommend a “Weekly Audit” of your new UI. Look beyond the “Views” and look for “Anomalies.”
The “Retention vs. Reach” Paradox
Sometimes, a post will have massive Reach but terrible Retention. The new UI makes this easy to spot.
- The Problem: High Reach/Low Retention means your “Hook” was great, but your “Value” was missing. You tricked people into watching, but they didn’t stay.
- The Fix: Focus on the middle of your videos. Ensure the transition from the hook to the body of the content is seamless and rewarding.
The “Profile Visit to Follower” Conversion Rate
If your Overview tab shows high “Profile Visits” but your Audience tab shows low “Follower Growth,” you have a “Bio Problem.”
- The Strategy: Use the new “Profile Banner Links” and “AI-generated Captions” to make your bio more compelling. The Insights UI is telling you that people are curious about you, but your profile page isn’t “closing the deal.”
The Future of Search: Insights Meets Instagram SEO
In 2026, Instagram has evolved into a powerful search engine. The new UI now includes “Search Discovery” insights, showing you which keywords led users to your profile.
Optimizing for the AI Search Function
Meta has implemented an AI-powered search at the end of Reel descriptions. The Insights UI now tracks how many people clicked through these “Related Searches.”
- Professional Tip: If your insights show that people are finding you through a specific keyword (e.g., “Sustainable Tech”), you should double down on that keyword in your captions, on-screen text, and hashtags. This creates a “Search Loop” where your content becomes the authoritative answer for those specific queries.
Conclusion: Embracing the Data-Driven Creative Journey
The 2026 Instagram Insights UI update is a testament to the platform’s commitment to creators. By moving away from “Vanity Metrics” like Likes and focusing on “Meaningful Engagement” like Sends and Retention, Instagram is raising the bar for content quality. As we navigate this new landscape at getindevice news, our advice is simple: listen to what the summary pills are telling you, but never lose the “Human Tone” that makes your brand unique.
Instagram’s updated Insights UI and new metrics are more than just a feature update-they’re a complete shift in how performance is measured.
Creators who adapt to:
- Behavioral metrics
- Retention-focused content
- Data-driven strategy
will have a massive advantage in 2026 and beyond.
Those who don’t?
They’ll keep chasing likes while others build real growth.